这是深度学习专项课程第一课第三周的编程作业,通过这次编程作业,可以学到:
用一个单隐层神经网络实现一个二元分类器
使用非线性的激活函数
计算交叉熵损失
实现前向和后向传播
包的引入 1 2 3 4 5 6 7 8 9 10 11 12 import numpy as np import matplotlib.pyplot as plt from testCases_v2 import * import sklearn import sklearn.datasetsimport sklearn.linear_modelfrom planar_utils import plot_decision_boundary, sigmoid, load_planar_dataset, load_extra_datasets %matplotlib.inline np.random.seed(1 )
数据集 加载数据 1 2 X, Y = load_planar_dataset()
1 2 3 4 5 6 7 8 9 10 11 12 13 14 15 16 17 18 19 20 21 22 > > def load_planar_dataset () : > np.random.seed(1 ) > m = 400 > N = int(m/2 ) > D = 2 > X = np.zeros((m,D)) > Y = np.zeros((m,1 ), dtype='uint8' ) > a = 4 > > for j in range(2 ): > ix = range(N*j,N*(j+1 )) > t = np.linspace(j*3.12 ,(j+1 )*3.12 ,N) + np.random.randn(N)*0.2 > r = a*np.sin(4 *t) + np.random.randn(N)*0.2 > X[ix] = np.c_[r*np.sin(t), r*np.cos(t)] > Y[ix] = j > > X = X.T > Y = Y.T > > return X, Y >
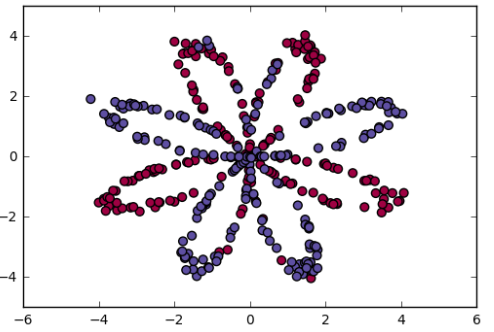
数据可视化 1 2 plt.scatter(X[0 , :], X[1 , :], c=Y, s=40 , cmap=plt.cm.spectral)
确定数据维度 1 2 3 4 5 6 7 8 shape_X = np.shape(X) shape_Y = np.shape(Y) m = X.shape[1 ] print('the shape of X is:' + str(shape_X)) print('the shape of Y is:' + str(shape_Y)) print('I have m = %d training examples!' %(m))
用 sklearn 库实现简单的逻辑回归 1 2 3 clf = sklearn.linear_model.logisticRegressionCV() clf.fit(X.T, Y.T)
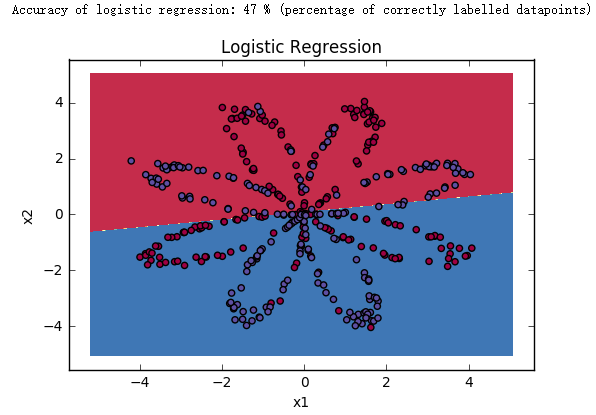
1 2 3 plot_decision_boundary(lambda x: clf.predict(x),X,Y) plt.title("Logistic Regression" )
1 2 3 4 5 6 7 8 9 10 11 12 13 14 15 16 > def plot_decision_boundary (model, X, y) : > > x_min, x_max = X[0 , :].min() - 1 , X[0 , :].max() + 1 > y_min, y_max = X[1 , :].min() - 1 , X[1 , :].max() + 1 > h = 0.01 > > xx, yy = np.meshgrid(np.arange(x_min, x_max, h), np.arange(y_min, y_max, h)) > > Z = model(np.c_[xx.ravel(), yy.ravel()]) > Z = Z.reshape(xx.shape) > > plt.contourf(xx, yy, Z, cmap=plt.cm.Spectral) > plt.ylabel('x2' ) > plt.xlabel('x1' ) > plt.scatter(X[0 , :], X[1 , :], c=y, cmap=plt.cm.Spectral) >
1 2 3 LR_predictions = clf.predict(X.T) print('Accuracy of logistic regression: %d ' % float( (np.dot(Y,LR_prediction) + np.dot(1 -Y,1 -LR_predictions))/float(Y.size)*100 ) + '%' + "(percentage of correctly labelled datapoints)" )
我们可以发现使用逻辑回归进行预测的准确度非常低!
神经网络模型 建立神经网络的一般方法
定义神经网络结构,包括输入特征个数,隐藏神经元个数等
初始化模型参数
循环以下步骤:
实现前向传播
计算代价函数
实现反向传播,得到梯度
使用梯度下降更新参数
将所有辅助函数合并到一个主函数 nn_model() 中
定义神经网络结构 1 2 3 4 5 6 7 8 def layer_sizes (X, Y) : n_x = X.shape[0 ] n_h = 4 n_y = Y.shape[0 ] return (n_x, n_h, n_y)
初始化模型参数 注意:
确保所有参数的尺寸正确
对于权重 W 采用随机初始化 的方法
对于偏差 b 采用初始化为零 的方法
1 2 3 4 5 6 7 8 9 10 11 12 13 14 15 16 17 18 19 20 21 def initialize_parameters (n_x, n_h, n_y) : W1 = np.random.randn(n_h, n_x)*0.01 b1 = np.zeros((n_h,1 )) W2 = np.random.randn(n_y, n_h)*0.01 b2 = np.zeros((n_y,1 )) assert (W1.shape == (n_h, n_x)) assert (b1.shape == (n_h,1 )) assert (W2.shape == (n_y, n_h)) assert (b2.shape == (n_y, 1 )) parameters = {"W1" : W1, "b1" : b1, "W2" : W2, "b2" : b2} return parameters
前向传播 步骤:
从 parameters 字典中取出每个参数
实现前向传播,计算 Z1,A1,Z2,A2 的值
把这些值放在字典 cache 中
1 2 3 4 5 6 7 8 9 10 11 12 13 14 15 16 17 18 19 20 21 22 23 24 25 def forward_propagation (X, parameters) : W1 = parameters["W1" ] b1 = parameters["b1" ] W2 = parameters["W2" ] b2 = parameters["b2" ] Z1 = np.dot(W1,X) + b1 A1 = np.tanh(Z1) Z2 = np.dot(W2,A1) + b2 A2 = sigmoid(Z2) assert (A2.shape == (1 , X.shape[1 ])) cache = {"Z1" : Z1, "A1" : A1, "Z2" : Z2, "A2" : A2} return A2, cache
计算代价函数 1 2 3 4 5 6 7 8 9 10 11 12 13 14 def compute_cost (A2, Y, parameters) : m = X.shape[1 ] logprobs = np.multiply(np.log(A2), Y) + np.multiply(np.log(1 -A2), (1 -Y)) cost = -(1 /m)*np.sum(logprobs) cost = np.squeeze(cost) assert (isinstance(cost,float)) return cost
反向传播
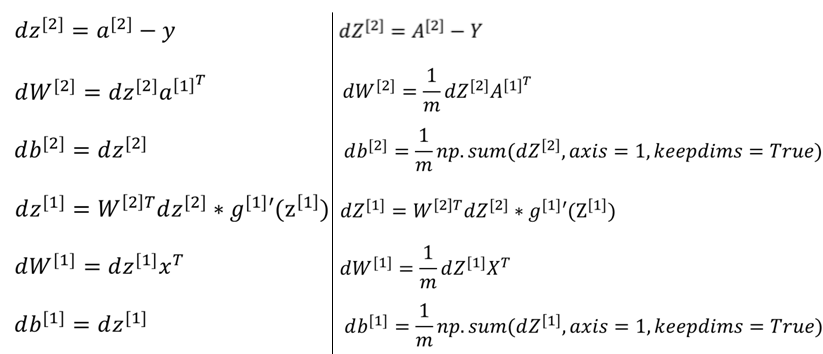
因为 $g^{[1]}(z) = tanh(z)$ , 所以 $g^{[1]’}(z) = 1-a^2$,所以可以使用 (1 - np.power(A1, 2)) 来计算 $g^{[1]’}(Z^{[1]})$
1 2 3 4 5 6 7 8 9 10 11 12 13 14 15 16 17 18 19 20 21 22 23 24 25 26 def back_propgation (parameters, cache, X, Y) : m = X.shape[1 ] W1 = parameters["W1" ] W2 = paramaters["W2" ] A1 = cache["A1" ] A2 = cache["A2" ] dZ2 = A2 - Y dW2 = (1 /m)*np.dot(dZ2,A1.T) db2 = (1 /m)*np.sum(dZ2,axis=1 ,keepdims=True ) dZ1 = np.multiply(np.dot(W2.T,dZ2),(1 -np.power(A1,2 ))) dW1 = (1 /m)*np.dot(dZ1,X.T) db1 = (1 /m)*np.sum(dZ1,axis=1 ,keepdims=True ) grads = {"dW1" : dW1, "db1" : db1, "dW2" : dW2, "db2" : db2} return grads
梯度下降 1 2 3 4 5 6 7 8 9 10 11 12 13 14 15 16 17 18 19 20 21 22 23 24 25 26 27 28 def update_parameters (parameters, grads, learning_rate = 1.2 ) : W1 = parameters["W1" ] b1 = parameters["b1" ] W2 = parameters["W2" ] b2 = parameters["b2" ] dW1 = grads["dW1" ] db1 = grads["db1" ] dW2 = grads["dW2" ] db2 = grads["db2" ] W1 = W1 - learning_rate*dW1 b1 = b1 - learning_rate*db1 W2 = W2 - learning_rate*dW2 b2 = b2 - learning_rate*db2 parameters = {"W1" : W1, "b1" : b1, "W2" : W2, "b2" : b2} return parameters
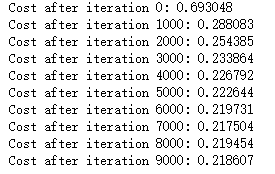
将以上所有辅助函数合并到主函数中 1 2 3 4 5 6 7 8 9 10 11 12 13 14 15 16 17 18 19 20 21 22 23 24 25 26 27 28 29 30 31 def nn_model (X, Y, n_h, num_iteration = 10000 , print_cost=False ) : n_x = layer_sizes(X, Y)[0 ] n_y = layer_sized(X, Y)[2 ] parameters = initialize_parameters(n_x, n_h, n_y) W1 = parameters["W1" ] b1 = parameters["b1" ] W2 = parameters["W2" ] b2 = parameters["b2" ] for i in range(0 , num_iterations): A2, cache = forword_propagation(X, paramaters) cost = compute_cost(A2, Y, parameters) grads = backward_propagation(parameters, cache, X, Y) parameters = update_parameters(parameters, grads, learning_rate = 1.2 ) if print_cost and i % 1000 == 0 : print("Cost after iteration %i: %f" %(i, cost)) return parameters
用模型进行预测 如果最后的预测值大于 0.5,则标签值为 1,反之标签值为 0
1 2 3 4 5 6 7 8 9 def predict (parameters, X) : A2, cache = forward_propagation(X,parameters) predictions = (A2 > 0.5 ) return predictions
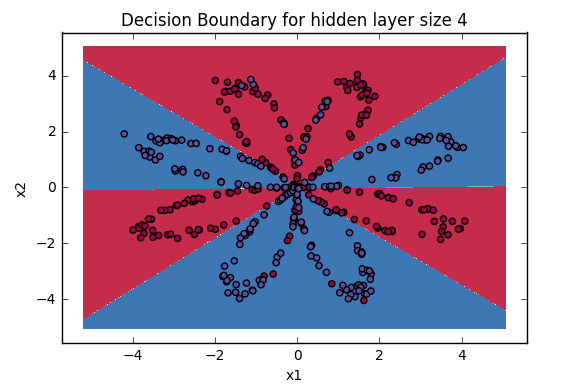
分析讨论 当隐藏节点个数为 4 时 1 2 3 4 5 6 7 8 9 10 parameters = nn_model(X, Y, n_h = 4 , num_iterations = 10000 , print_cost=True ) plot_decision_boundary(lambda x: predict(parameters, x.T), X, Y) plt.title("Decision Boundary for hidden layer size " + str(4 )) predictions = predict(parameters, X) print ('Accuracy: %d' % float((np.dot(Y,predictions.T) + np.dot(1 -Y,1 -predictions.T)) / float(Y.size)*100 ) + '%' )
我们可以看到对比逻辑回归,四个隐藏节点的神经网络模型的预测精确度非常高!
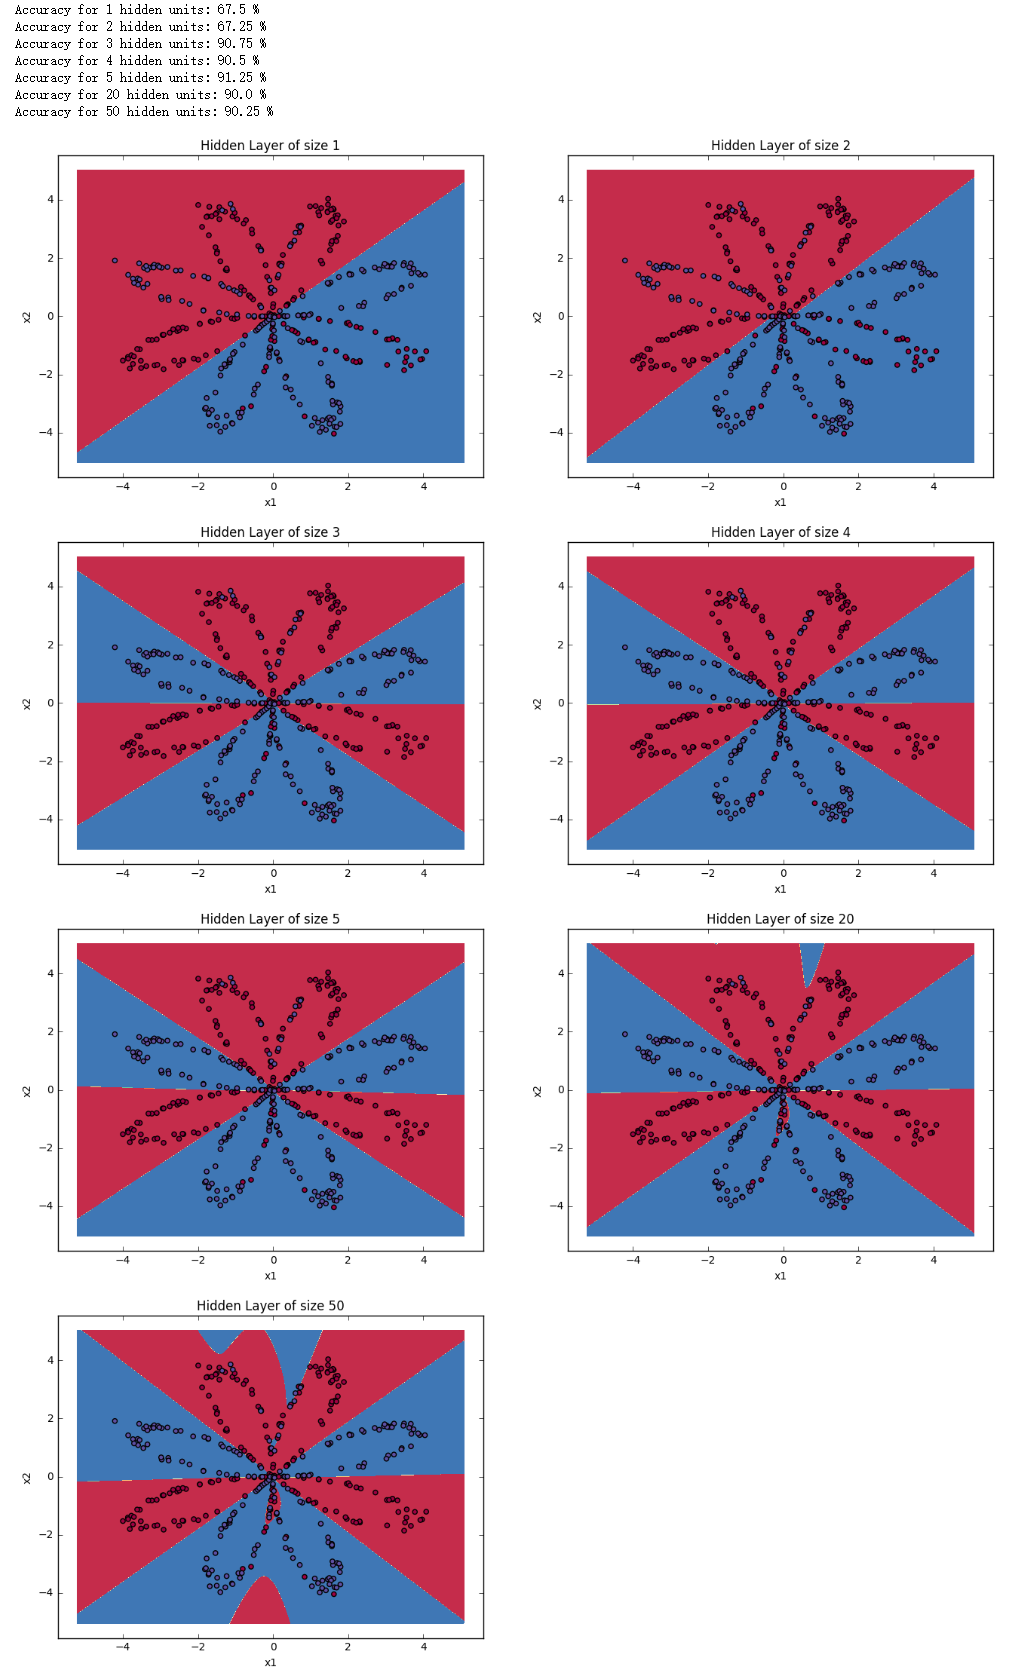
接下来我们看看不同隐藏节点对预测结果的影响。
改变隐藏节点个数观察结果 1 2 3 4 5 6 7 8 9 10 11 plt.figure(figsize=(16 , 32 )) hidden_layer_sizes = [1 , 2 , 3 , 4 , 5 , 20 , 50 ] for i, n_h in enumerate(hidden_layer_sizes): plt.subplot(5 , 2 , i+1 ) plt.title('Hidden Layer of size %d' % n_h) parameters = nn_model(X, Y, n_h, num_iterations = 5000 ) plot_decision_boundary(lambda x: predict(parameters, x.T), X, Y) predictions = predict(parameters, X) accuracy = float((np.dot(Y,predictions.T) + np.dot(1 -Y,1 -predictions.T))/float(Y.size)*100 ) print ("Accuracy for {} hidden units: {} %" .format(n_h, accuracy))
得出结论
隐藏节点的个数越多,对数据集的拟合程度越好,直到最终发生过拟合
最好的隐藏节点个数似乎大概在 5 个左右,在这个值附近的的模型对数据集拟合得很好且没有发生过拟合
regularization 是减小大型模型(比如 n_h = 50)过拟合的一个方法,在后面会学到
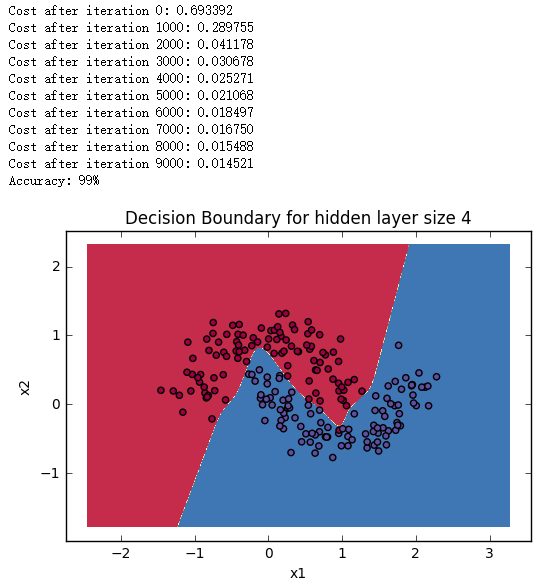
更换其他数据集进行试验 1 2 3 4 5 6 7 8 9 10 11 12 13 14 15 16 17 18 19 20 21 22 23 24 25 26 27 28 29 30 noisy_circles, noisy_moons, blobs, gaussian_quantiles, no_structure = load_extra_datasets() datasets = {"noisy_circles" : noisy_circles, "noisy_moons" : noisy_moons, "blobs" : blobs, "gaussian_quantiles" : gaussian_quantiles} dataset = "noisy_circles" X, Y = datasets[dataset] X, Y = X.T, Y.reshape(1 , Y.shape[0 ]) if dataset == "blobs" : Y = Y%2 plt.scatter(X[0 , :], X[1 , :], c=Y, s=40 , cmap=plt.cm.Spectral); parameters = nn_model(X, Y, n_h = 5 , num_iterations = 10000 , print_cost=True ) plot_decision_boundary(lambda x: predict(parameters, x.T), X, Y) plt.title("Decision Boundary for hidden layer size " + str(4 )) predictions = predict(parameters, X) print ('Accuracy: %d' % float((np.dot(Y,predictions.T) + np.dot(1 -Y,1 -predictions.T))/float(Y.size)*100 ) + '%' )
